
Nature Risks Module
You do not see this module in your platform and would like to try it out? Please get in touch with us.
Overview
The Risk Module translates environmental data into business-relevant risk insights, building on Nala’s State of Nature and Impacts & Dependencies modules. It connects the condition of nature with a company’s interaction with nature to estimate the likelihood and financial impact of nature-related risks. It helps users understand where and how their business is financially exposed to both the loss of natural systems and the transition toward a nature-positive economy - directly supporting the “Assess” step of TNFD’s LEAP framework (Locate, Evaluate, Assess, Prepare).
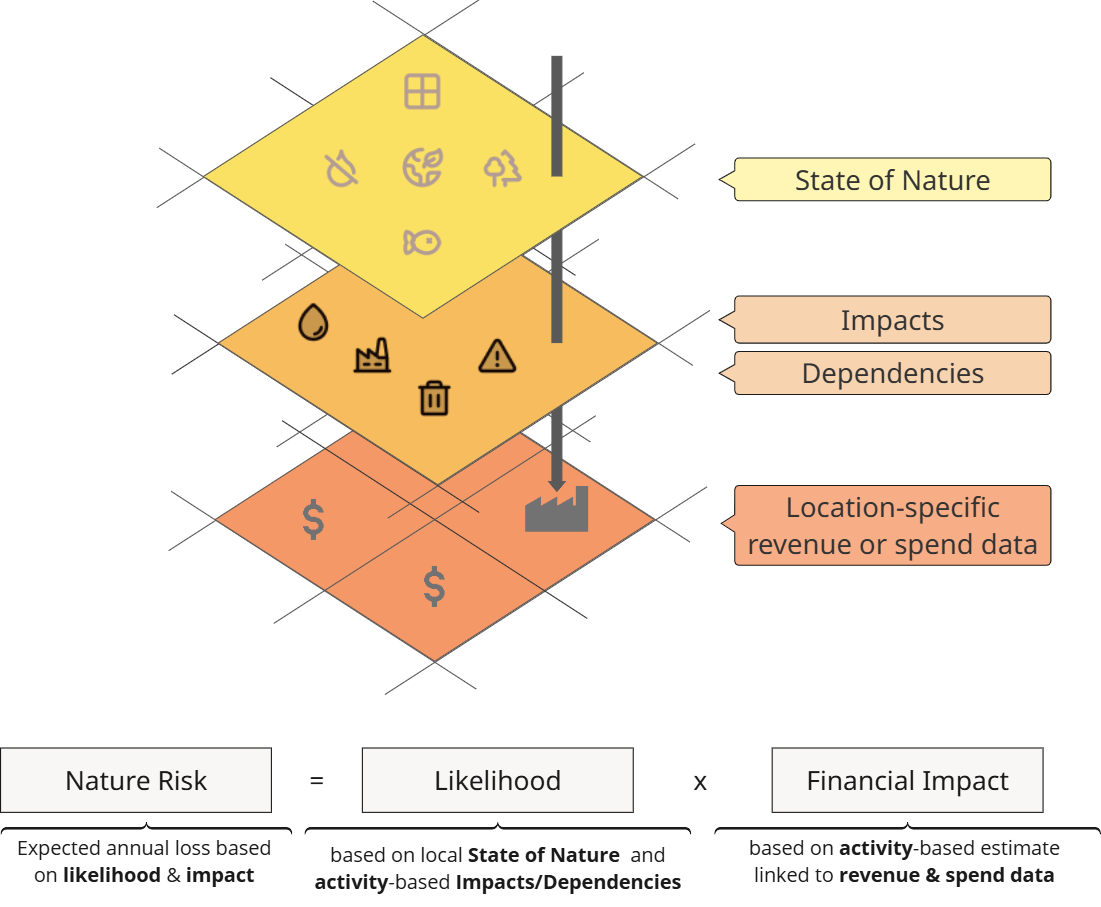
Combining environmental intelligence with financial reasoning, the module acts as an early warning system and decision-support tool. It identifies where risks are most likely to occur, how significant their financial impact could be, and what drives them. This enables sustainability managers and risk officers to better prioritize risk mitigation interventions - whether by investing in water efficiency at high-risk sites, strengthening deforestation monitoring in the supply chain, or establishing more natural and near-natural areas on their sites to sustain essential ecosystem services.
Why is this important? Nature-related risks - from water scarcity to new biodiversity regulations - are increasing. The Risk Module offers a systematic, location-based approach to quantify these risks, supporting strategic risk management and disclosure under TNFD and CSRD.
What are Nature-Related Risks?
In the context of this module, nature-related risks are grouped into two broad categories: Transition Risks and Physical Risks.
- Transition Nature Risks stem from how your business impacts nature, especially as society moves toward a more nature-positive economy. These include risks from new environmental regulations, market shifts, or reputational backlash in response to your company’s negative impacts on ecosystems.
- Physical Nature Risks stem from your dependence on nature and ecosystem services. They arise when the ecosystems you rely on (for resources, services, or stability) are degrading or failing.
Below we explain each category and the specific risks the module currently covers.
Transition Nature Risks (Impacts-Driven)
Transition risks are business risks that arise from your business’ negative impacts on nature as economies move toward nature-positive practices. They include policy and liability, technology, market, and reputational risks - all driven by societal, regulatory, or market responses to environmental degradation. The Risk Module currently assesses three key transition risks:
- Land Use Restriction Risk: This risk reflects the possibility of new protected areas or land-use regulations that could limit your operations. Companies operating in or near biodiversity-sensitive areas face a higher chance of stricter permitting or land use constraints – for example, in response to global targets like “30x30” (protecting 30% of land by 2030). If a site has a large land footprint (high land use impact) in an ecologically important area, it faces a higher Land Use Restriction risk.
- Deforestation Risk: This is the risk of legal penalties or reputational damage arising from deforestation-related laws and market expectations. With regulations such as the EU Deforestation Regulation (EUDR) requiring deforestation-free supply chains, companies sourcing from or operating in regions with high deforestation rates face elevated exposure. Sites located in countries classified as high-risk under the EUDR and showing recent tree cover loss are assigned a higher Deforestation Risk. This can translate into potential supply chain interruptions, legal penalties, or reputational fallout.
- Pollution Risk: This risk reflects potential fines, liabilities, or operational limits from stricter pollution controls. It is higher for sites with significant emissions (to air, water, or soil), especially those located in biodiversity-sensitive areas subject to greater regulatory and public scrutiny. Sites producing high levels of toxic, nutrient, or solid waste emissions in such regions face elevated Pollution Risk, indicating a higher likelihood of regulatory action or legal exposure.
Each transition risk’s likelihood is informed by combining an indicator of the site’s environmental context (e.g. biodiversity importance or country deforestation rating) with the relevant impact driver from your operations. In essence, a high impact in a sensitive context leads to a higher risk probability.
Physical Nature Risks (Dependency-Driven)
Physical risks arise from the degradation or loss of ecosystem services that a business depends on. They can take the form of acute events (such as floods, fires, or droughts) or chronic pressures (like water stress, declining soil fertility, or biodiversity loss). The Risk Module focuses on three common physical risks that extend beyond typically assessed acute climate risks:
- Loss of Water Supply: Many operations rely on a steady supply of freshwater for irrigation, cooling, or processing. This risk estimates the likelihood of reduced water availability due to local water scarcity. Sites with high water dependency (e.g. agriculture, beverage manufacturing) in water scarce areas face elevated Water Supply Risk, which can lead to production slowdowns or interruptions, or investment needs in water-saving measures.
- Loss of Freshwater Quality: This risk reflects the potential deterioration of water quality due to pollution, nutrient runoff, or sedimentation. Sites that depend on clean water and are located in areas with polluted rivers or aquifers face higher Freshwater Quality Risk, leading to increased treatment costs, compliance issues, or production disruptions.
- Loss of Biodiversity-Dependent Services: Ecosystems provide many services that businesses rely on - such as pollination, flood regulation, water purification, etc. These services depend on healthy biodiversity. This risk reflects the potential loss of these services due to biodiversity decline. Sites with a high reliance on ecosystem services in areas where biodiversity is deteriorating face elevated Biodiversity-Dependent Services Risk, which can result in reduced productivity, higher costs, or operational disruptions.
(Each physical risk’s likelihood is derived by combining a site’s dependency on a given ecosystem service with the state of that ecosystem in the area. In other words, high dependency in a degraded ecosystem leads to a higher probability of disruption.)
The current coverage of six nature-related risks provides a focused starting point. Additional risks will be introduced over time as new data and methodologies are developed and become available.
How does Nala’s Risk Module Work?
Likelihood × Financial Impact = Expected Loss
The Risk Module applies an approach aligned with common enterprise risk management practice: combining Likelihood and Financial Impact for each risk at each site to estimate the Expected Financial Loss.
1. Likelihood
Each risk is assigned a Likelihood level from Very Low to Very High, indicating how likely the risk is to materialize in a given year.
- For transition risks, likelihood increases when a site exerts strong environmental pressure (e.g. emissions, land use) in a biodiversity-sensitive or regulated area.
- For physical risks, likelihood rises with greater dependency on nature and poorer local ecosystem conditions (e.g. high water use in water-stressed areas).
- The likelihood levels are derived by combining relevant State of Nature indicators and Impact/Dependency metrics.
- For each economic activity, the categorical likelihood is translated into an approximate annual probability of occurrence, which can be customized with company-specific data and assumptions.
2. Financial Impact
The Financial Impact estimates the potential financial loss if the risk materializes.
- To keep the assessment pragmatic, the Financial Impact is expressed as a share of revenue (or supplier spend). This offers a clear and comparable way to estimate the financial relevance of each risk across sites and activities. It aligns with TNFD’s recommendation to assess financial materiality based on revenue, while extending it by estimating the revenue share expected to be actually affected.
- Activity-specific default impact values are are provided, based on research on typical exposure levels. The impact values can be adjusted with company-specific data and assumptions.
- Physical and land-use risks are based on site-level revenue, while Pollution and Deforestation risks are based on company-level revenue since fines or liabilities are typically applied at the corporate scale.
- Financial Impacts are categorized from Very Low to Very High, using absolute thresholds relative to total company revenue. Helping you categorize financial materiality across your business.
3. Expected Financial Loss
Each risk’s Expected Annual Loss combines the likelihood and financial impact:
Expected Financial Loss = Likelihood × Financial Impact
This represents the average annual risk exposure in monetary terms.
- At site level, the module sums the expected losses of all risks to show the site’s total nature-related exposure.
- At company level, physical risks are added directly across sites, while company-wide transition risks are aggregated probabilistically to avoid double counting.
The result is a clear, comparable view of which risks and sites drive your greatest expected financial losses. For more details on Expected Financial Loss, see our methodology articles.
The Nature Risk Dashboard
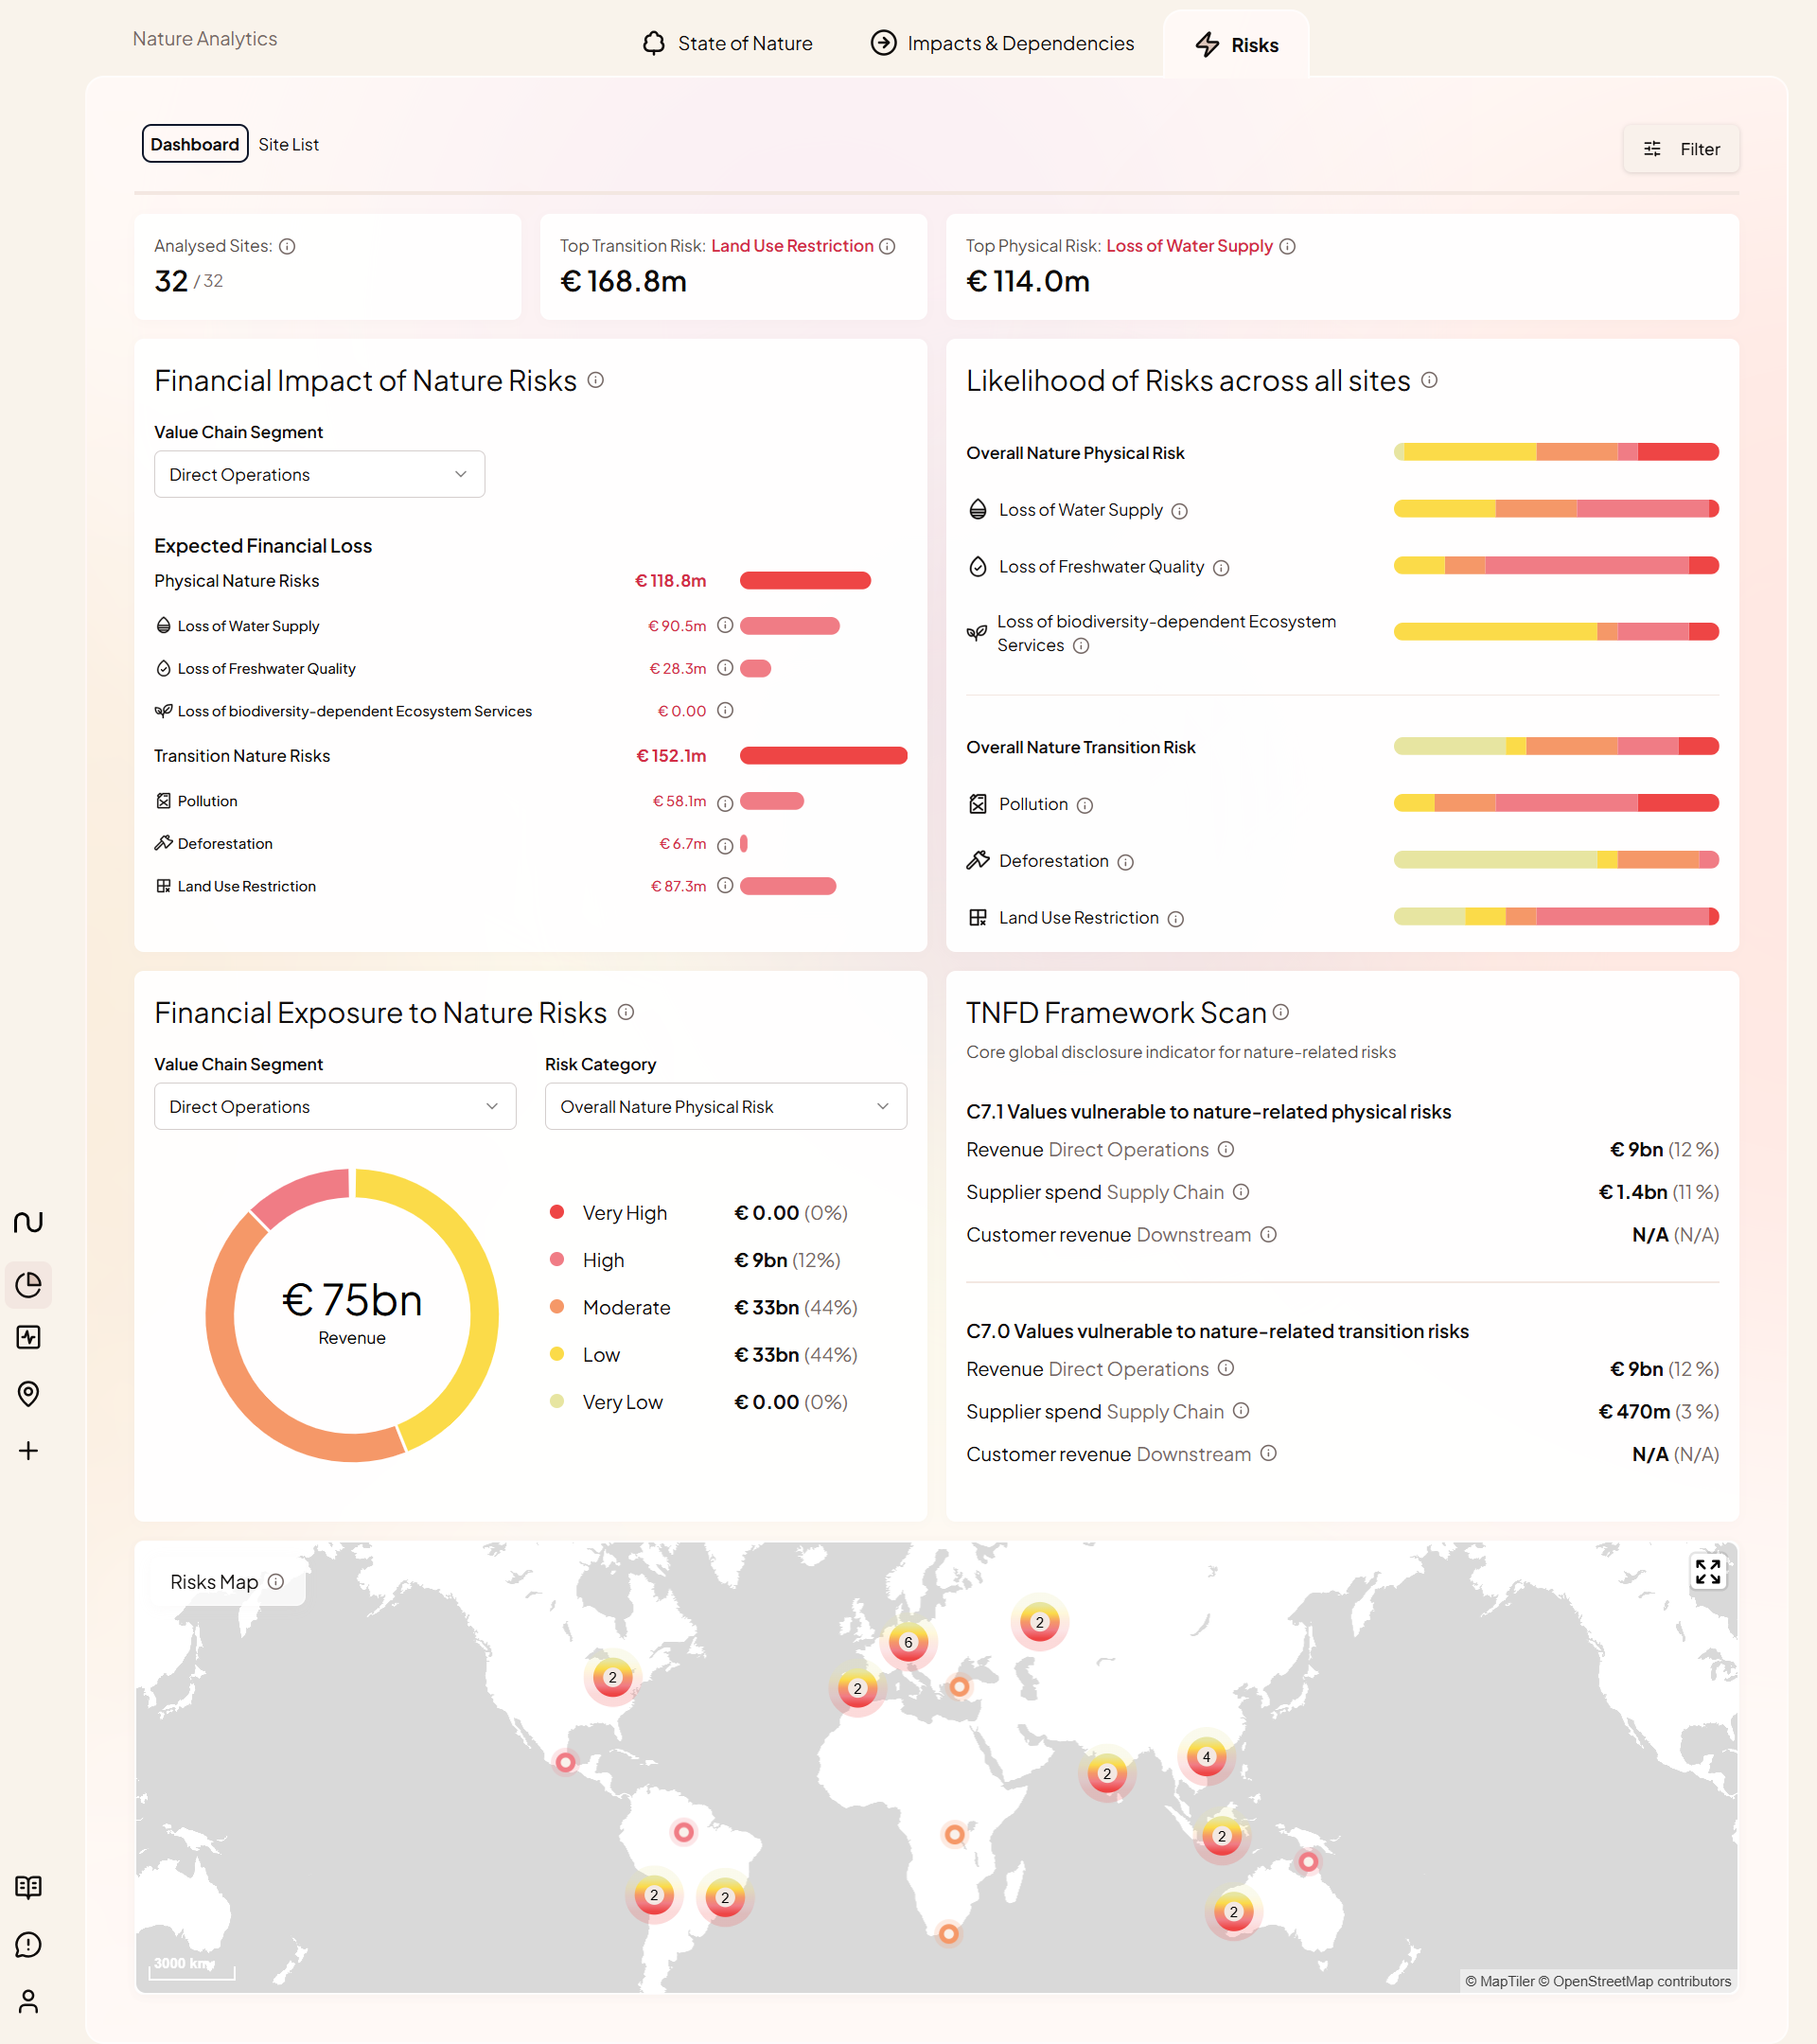
The dashboard provides a portfolio-level overview of how nature-related risks translate into potential financial consequences. It summarizes key indicators for expected financial loss, likelihood distribution, an revenue exposure.
Top Nature Risk
The Top Physical Risk and Top Transition Risk are determined based on the highest Expected Financial Loss across the company portfolio. This highlights which risk categories currently drive the greatest expected financial exposure and should be prioritised for management attention.
Financial Impact of Nature Risks
Financial Impact of Nature Risks summarizes how likely and financially significant each nature-related risk is for the selected value chain segment (out of Direct Operations, Downstream and Upstream). The chart positions risks by likelihood and financial impact, while the values indicate the total annual expected financial loss for each risk across all sites of the value chain segment.
For a detailed explanation of how financial impact is calculated, check out our explainer here.
Likelihood of Risks across all sites
The bar chart shows how the analysed sites are distributed across the different Likelihood levels for each risk, indicating how likely each risk is to occur - rated from Very Low to Very High. The graph allows users to identify how many sites face highly probable or unlikely nature-related risks, offering a portfolio-wide perspective of exposure based on number of sites, rather than financial values.
The Overall Nature Risk Level reflects the combined exposure of company sites to nature-related risks, based on the likelihood of individual physical or transition risks. For this, the likelihood levels of each site’s assessed risks are aggregated into an Overall Nature Physical Risk Level and an Overall Nature Transition Risk Level, each ranging from Very Low to Very High.
For more details on how Overall Nature Transition Risk Level and Overall Nature Physical Risk Level are calculated, see this methodology article.
Financial Exposure to Nature Risks & TNFD Framework Scan
Financial Exposure to Nature Risks shows the share of revenue or expenses exposed to the selected Risk Category within a chosen Value Chain Segment. It aggregates site-level exposure by Likelihood level, illustrating how total exposure (revenue, customer revenue, or supplier spend) is distributed from Very Low to Very High likelihood. This view supports nature-related disclosure frameworks, including TNFD, which require reporting on revenue exposure to nature-related risk levels.
The TNFD Framework Scan summarizes the specific values needed for disclosure under TNFD indicators C7.0 and C7.1, showing exposure to transition and physical risks across operations and the value chain. Sites with High or Very High likelihood are considered vulnerable and included in the reported exposure.
The Nature Risk List View
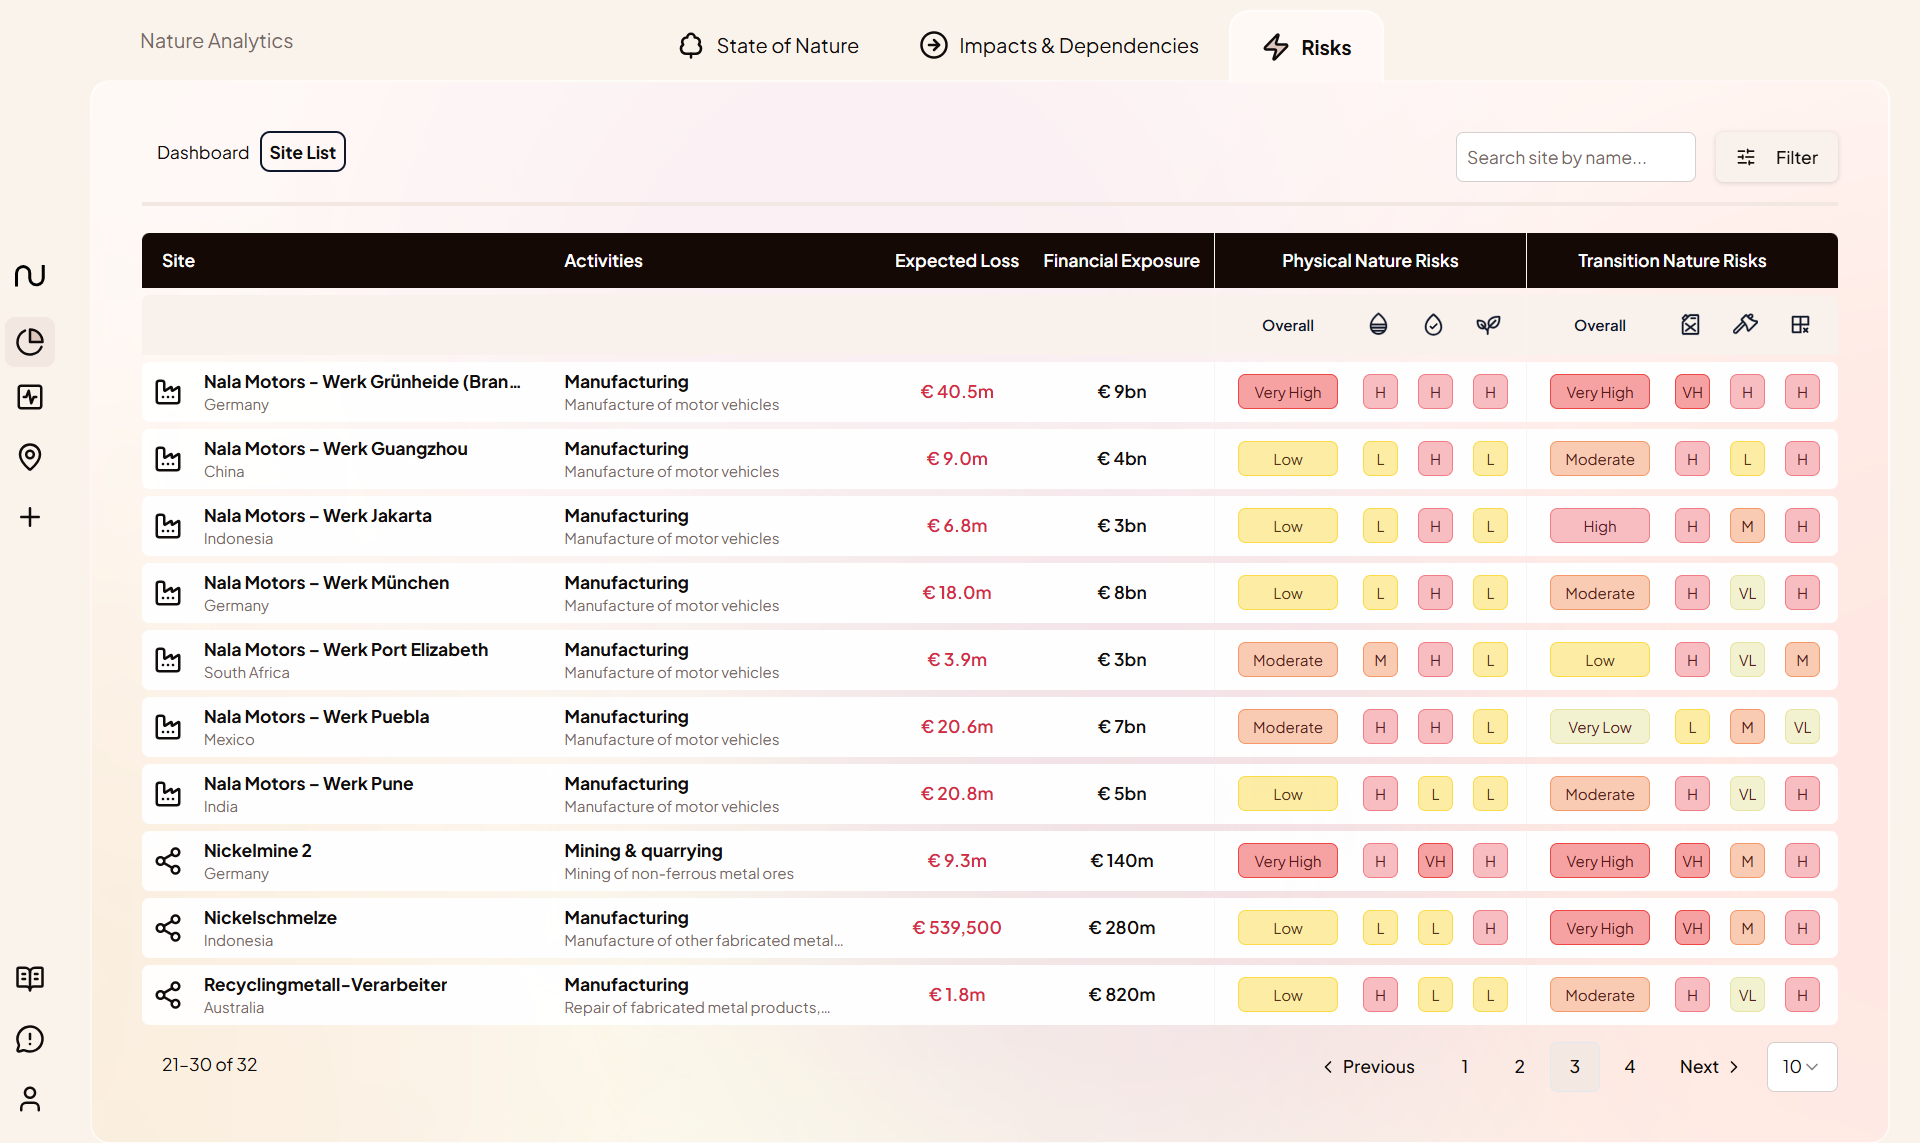
The Risk Module Site List view shows all assessed sites, summarizing for each site the risk likelihoods, the financial exposure and expected financial loss. You can navigate to the individual Site View by selecting a row .
 The Nature Risk Site View
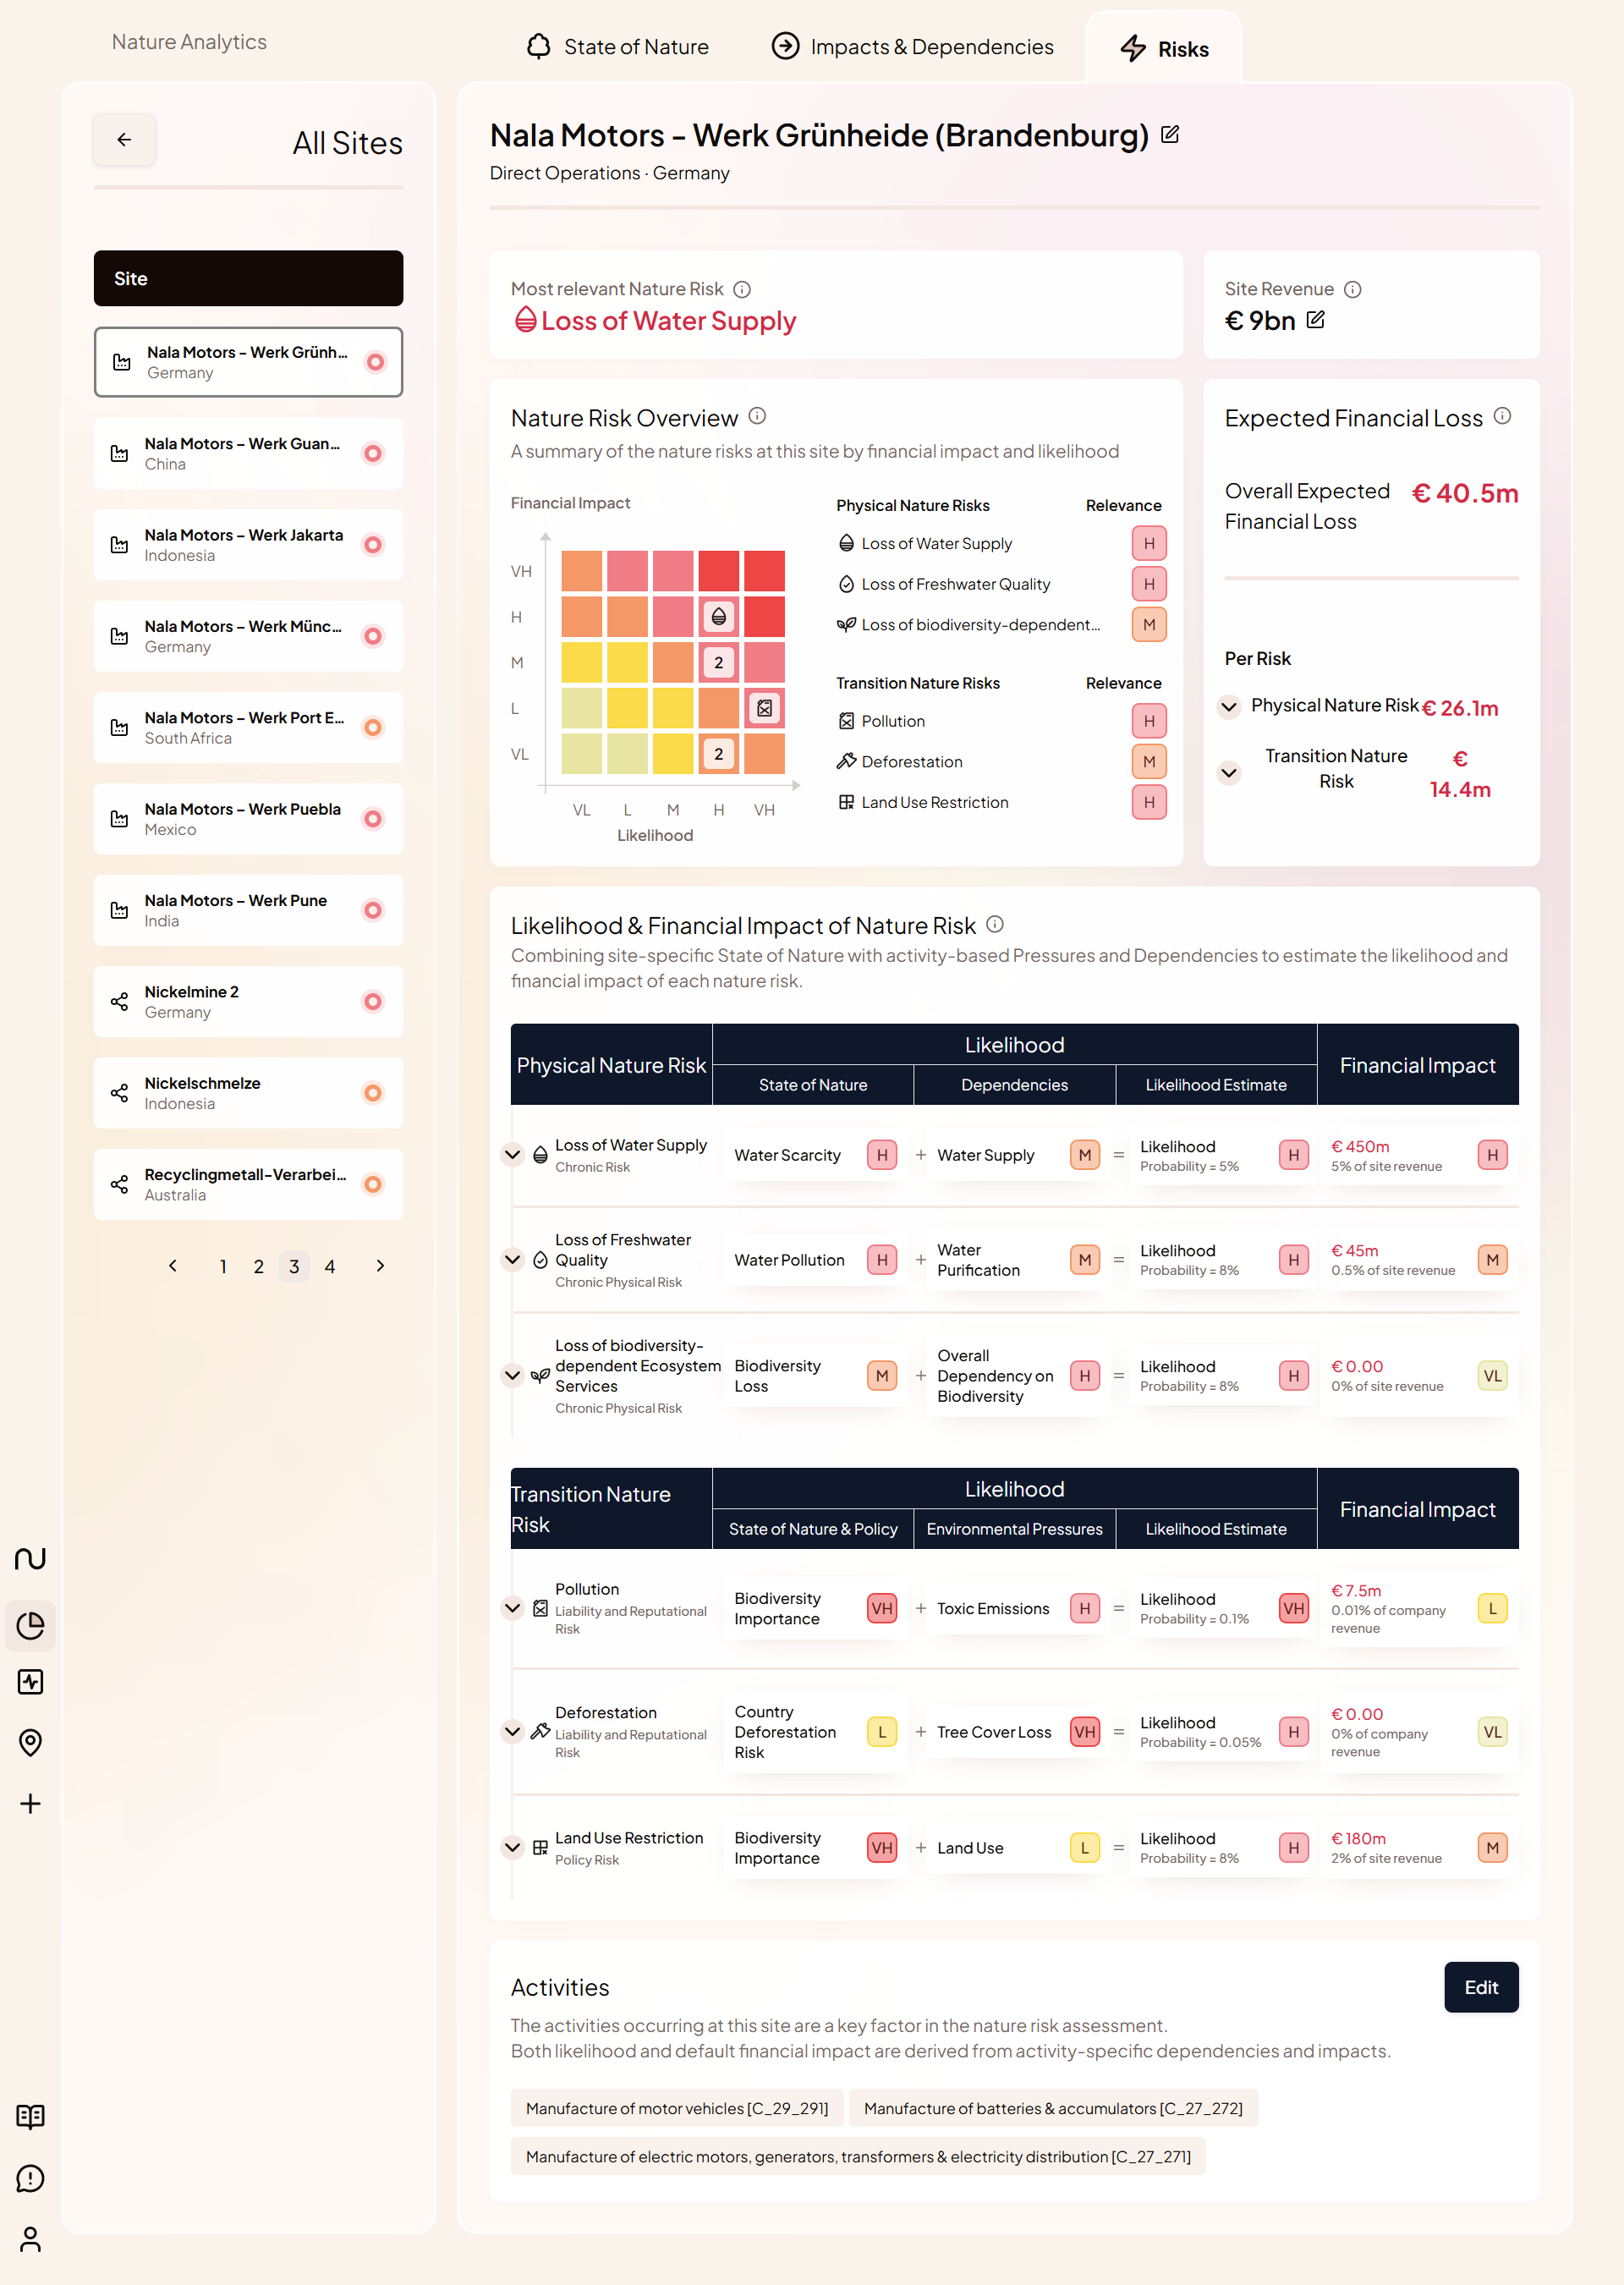
The Site View provides a detailed overview of nature-related risks at an individual site, showing how local environmental conditions and business activities combine to determine financial exposure. In this Section, we'll explain the different numbers and graphics available at the site view level.
 Most Relevant Nature Risk
Highlights the risk with the highest expected financial loss for the site. This allows to quickly identify which nature-related issue poses the most significant financial exposure based on the site’s operations and context.
Site Revenue
Displays the revenue linked to the site (or supplier spend, depending on the value chain segment). This value is used to calculate the site’s Financial Impact and Expected Financial Loss across all risks. Revenue data can be entered or updated directly in this view or through the Site Management settings.
Nature Risk Overview
The Nature Risk Overview provides a summary of the nature-related risks identified for the site. The risk matrix plots each risk by its Likelihood (x-axis) and Financial Impact (y-axis) aligned with common practice in enterprise risk management. The resulting Relevance Level is determined by the combination of Likelihood and Financial Impact (Very Low to Very High). This overview gives an at-a-glance understanding of which risks are both likely and financially material for the site.
Financial Impacts are classified from Very Low to Very High using absolute thresholds relative to total company revenue. The same thresholds are applied consistently at both site and company level, enabling a clear and comparable view of financial materiality across the business.
Category | Financial Impact threshold |
|---|---|
Very Low | <0.01% of company revenue |
Low | <0.05% |
Moderate | <0.25% |
High | <1% |
Very High | ≥1% |
Expected Financial Loss
Summarizes the Expected Financial Loss for all covered risks at the site, combining both Physical and Transition risks. The calculation uses site-specific probabilities of occurrence and financial impact estimates to quantify potential annual exposure.
Expected Loss = Likelihood × Financial Impact
- The Overall Expected Financial Loss represents the sum of all individual risk exposures at the site.
- Separate values are shown for each Physical and Transition Nature Risk.
- These estimates enable comparison of relative financial exposure across different risks and sites.
How is Expected Financial Loss Calculated?

- p_r,i = annual probability for risk r at site i (derived from the Likelihood category)
- FI_r,i = monetary financial impact if the risk materialises at site i
EFL_site i represents the total expected annual financial loss for site i. The calculation methodology assumes that the individual risks are independent, meaning that the likelihood of one risk occurring does not influence the likelihood of another. Under this assumption, each risk’s expected loss can be added directly, providing an estimate of the average annual loss exposure for the site. This assumption is a simplification and may underestimate total exposure when risks are positively correlated, however, it provides a transparent and consistent baseline for comparing exposure across sites and risk categories.
Likelihood & Financial Impact of Nature Risks
The table provides a detailed and transparent explanation of how each risk rating is derived. It summarizes how likelihood and financial impact are derived for each risk. Likelihood is estimated by combining the site’s State of Nature with relevant Pressures or Dependencies of site activities.
How Likelihood Levels are derived
For each nature-related risk, Nala combines a State of Nature concern level (Very Low to Very High) with the Impact or Dependency intensity of the site’s activities (Very Low to Very High). This matrix illustrates how the site-specific environmental conditions and activity intensity are translated into a single Likelihood level from Very Low to Very High.
Impact / Dependency ↓ \ State of Nature → | VL | L | M | H | VH |
|---|---|---|---|---|---|
VH | M | H | H | VH | VH |
H | M | M | H | H | VH |
M | L | L | M | H | H |
L | VL | L | L | M | H |
VL | VL | VL | L | M | M |
The resulting likelihood level reflects the probability that the risk will materialize within a year. Financial Impact represents the estimated share of site or company revenue that would be affected if the risk occurred. Together, these two dimensions form the basis for calculating the site’s Expected Financial Loss for each nature-related risk.
Physical Nature Risks
Physical risks are assessed high dependency combined with degraded ecosystems results in higher likelihood and expected loss.
Risk | State of Nature | Dependencies | Likelihood Estimate | Financial Impact |
|---|---|---|---|---|
Loss of Water Supply | Based on local water scarcity | Water supply dependency | Likelihood increases where high dependency coincides with high water scarcity | Impact defined as % of site revenue |
Loss of Freshwater Quality | Based on local water pollution levels | Water purification dependency | Likelihood increases when pollution pressure is high and water quality is poor | Impact defined as % of site revenue |
Loss of Biodiversity-Dependent Services | Based on local biodiversity loss | Dependency on biodiversity-dependent Ecosystem Services | Likelihood increaseFs when biodiversity is declining and dependency is high | Impact defined as % of site revenue |
Transition Nature Risks
Transition risks arise from policy, regulatory, and reputational changes linked to company impacts.
Likelihood increases when strong environmental pressures occur in sensitive or high-regulation contexts.
Financial Impact for Pollution and Deforestation is scaled to company-level revenue, since related fines or liabilities apply at the corporate scale.
Risk | State of Nature / Policy Context | Environmental Pressure | Likelihood Estimate | Financial Impact |
|---|---|---|---|---|
Pollution | Biodiversity importance | Emissions intensity | Higher where emissions occur in biodiversity-sensitive or regulated areas | Impact as % of company revenue |
Deforestation | EUDR country deforestation risk classification | Tree cover loss | Higher in high-risk countries and where forest loss is detected | Impact as % of company revenue |
Land Use Restriction | Biodiversity importance | Land use intensity | Higher near protected or high-biodiversity areas | Impact as % of site revenue |
The Deforestation Risk assessment uses the EU Deforestation Regulation (EUDR) country classifications as part of the Policy Concern Level following this logic
EUDR Classification | Nala Policy Concern Level |
|---|---|
Low EUDR Risk | Low |
Standard EUDR Risk | High |
High EUDR Risk | Very High |
Activity & Default Probability and Financial Impact Estimates
This section lists the economic activities occurring at the site, following the ENCORE classification covering 271 economic activities. The activities are key drivers of its overall nature-related risk profile as the likelihood, probability of occurrence and default financial impact are derived from their specific dependencies and impacts.
- Likelihood depends on activity-specific dependencies and impacts (e.g. water use, emissions, land use).
- Furthermore, for the calculation of Expected Financial Loss each likelihood level is translated to a default annual probability of occurrence per risk (for example, “Moderate” ≈ 10% per year, “High” ≈ 25%). These default probabilities are provided for all activities and can be reviewed or adjusted in the Global Settings.
- Financial Impact uses default revenue-based percentages linked to each activity, representing the estimated financial loss if the risk materializes. Each activity–risk combination includes a default financial impact percentage and a short justification of the assumed exposure level. These values are designed as transparent starting points and should be customized with company-specific data and assumptions in the Global Settings.
Activities can be entered or updated directly in this view or through the Site Management settings.
How to get the Most out of the Risk Module
To ensure the risk analysis is accurate and tailored to your business, there are a few data inputs and customization options you should know about:
- Revenue data: The Risk Module delivers the most accurate results when each site has an associated economic value, as the Financial Impact is calculated as a percentage of that value.
Within the Site View, you can enter: - Revenue for direct operation sites
- Customer revenue for downstream sites
- Supplier spend for supplier sites
These values reflect the site’s role in your value chain. You’ll be prompted to add them during site creation or data import, and they can be edited at any time in the Site View or under Site Management. If revenue data for a site is unknown or unavailable, you can enter a default site revenue or leave it at zero - though a zero value will exclude that site from aggregated financial calculations.
- Total Company Revenue: Some risk calculations - specifically company-wide transition risks such as pollution fines or deforestation-related liabilities - are based on your business 'total company revenue. This value is also used to categorize the Financial Impact from Very Low to Very High. Users are prompted to provide your annual company revenue (a single figure) in the settings. If this value is not entered, the module may not be able to calculate or categorize risk impacts accurately.
- Override Default Financial Impacts and Probability of Occurrence: Nala provides default values for both the Financial Impact (as a share of revenue) and the probability of occurrence for each risk. These values are derived from research and linked to the site’s economic activity. However, company-specific knowledge or local conditions may justify different assumptions.
The Risk Module allows users to override these defaults to ensure that risk estimates better reflect their operational reality: - In the Global Settings within Site Management, you can adjust the default annual probability linked to your activities for each risk and Likelihood level.
- You can also modify the default Financial Impact percentages for any activity–risk combination.
- Over time, these inputs can be refined to make the assessment more representative of your company’s specific context.
- This functionality can also support scenario analysis. For example, you can simulate stricter future regulations by increasing a probability value or assess the effect of mitigation measures by lowering an impact percentage to estimate the resulting reduction in expected losses.
- Keep Data Current: Nature-related risk is dynamic. The environmental data (like water scarcity or tree cover loss) are periodically updated on Nala’s platform. You should also review and update your site data whenever significant changes occur in operations, supply chains, or locations. Keeping both environmental and company data up to date ensures that your risk outputs remain accurate and decision-relevant. We recommend reviewing the Risk Dashboard after any major operational change and at least once a year as part of your regular risk assessment cycle.