
Land - Land Cover (Loss of Natural Area)
Summary
Data Type | High-resolution land use map based on satellite imagery and AI-powered land classification models |
Source | |
Spatial Resolution | 10m x 10m |
Temporal Resolution | Annual updates |
Interpretation | The site area is screened for the the loss of natural area since 2020. The indicators concern level indicates how concerning the extent of lost natural area is. Furthermore, the indicator enables the visual and quantitative analysis of what land cover types occur at the assessed site and how land cover has changed over time. |
Concern Levels | Very Low = No loss of natural area since 2020 Low = Minor loss of natural area since 2020 (less than 0.016%) Moderate = Moderate loss of natural area since 2020 (between 0.016% and 0.58%) High = Strong loss of natural area since 2020 (between 0.58% and 3.73%) Very High = Very strong loss of natural area since 2020 (more than 3.73%) |
Framework Relevance | Land Cover - Loss of Natural Area is relevant under CSRD (ESRS E4) as well as under TNFD and SBTN. |
Detailed Specifications
Explanation
Land cover refers to the physical makeup of the Earth´s surface, differentiating between different natural or man-made surface features that define an area. Analyzing land cover over time provides crucial insights into the environmental state of an area, revealing patterns of land conversion. This land cover indicator is based on a global-scale 10-meter land cover data set provided by ESRI. The dataset is based on Sentinel-2 satellite imagery to which a trained deep learning model for land classification is applied in order to predict the most likely land cover of a 10mx10m area for each year. The model differentiates between 8 classes of land cover, namely Trees, Rangeland (Grass & Scrub), Flooded Vegetation, Water, Snow/Ice, Built-up, Crops, and Bare Ground.
Note on the distinction between land cover and land use: Land cover and land use are related concept and often used interchangeably. However, there is a distinction in that land cover refers to the physical features on the Earth's surface, such as forests, water bodies, or urban infrastructure. Land use, in contrast, describes how humans utilize the land, such as for agriculture, residential areas, or conservation. The present indicator focuses on land cover.
Land Cover Class | Definition |
|---|---|
Trees | Any significant clustering of tall (~5 meters or higher) dense vegetation, typically with a closed or dense canopy; examples: wooded vegetation, clusters of dense tall vegetation within savannas, plantations, swamp or mangroves (dense/tall vegetation with ephemeral water or canopy too thick to detect water underneath) |
Rangeland | Open areas covered in homogeneous grasses with little to no taller vegetation; wild cereals and grasses with no obvious human plotting (i.e., not a plotted field); examples: natural meadows and fields with sparse to no tree cover, open savanna with few to no trees, parks/golf courses/lawns, pastures. Mix of small clusters of plants or single plants dispersed on a landscape that shows exposed soil or rock; scrub-filled clearings within dense forests that are clearly not taller than trees; examples: moderate to sparse cover of bushes, shrubs and tufts of grass, savannas with very sparse grasses, trees or other plants. |
Flooded vegetation | Areas of any type of vegetation with obvious intermixing of water throughout a majority of the year; seasonally flooded area that is a mix of grass/shrub/trees/bare ground; examples: flooded mangroves, emergent vegetation, rice paddies and other heavily irrigated and inundated agriculture. |
Water | Areas where water was predominantly present throughout the year; may not cover areas with sporadic or short-lived water; contains little to no sparse vegetation, no rock outcrop nor built up features like docks; examples: rivers, ponds, lakes, oceans, flooded salt plains. |
Snow/Ice | Large homogeneous areas of permanent snow or ice, typically only in mountain areas or highest latitudes; examples: glaciers, permanent snowpack, snow fields. |
Built-up area | Human made structures; major road and rail networks; large homogeneous impervious surfaces including parking structures, office buildings and residential housing; examples: houses, dense villages / towns / cities, paved roads, asphalt. |
Crops | Human planted/plotted cereals, grasses, and crops not at tree height; examples: corn, wheat, soy, fallow plots of structured land. |
Bare ground | Areas of rock or soil with very sparse to no vegetation for the entire year; large areas of sand and deserts with no to little vegetation; examples: exposed rock or soil, desert and sand dunes, dry salt flats/pans, dried lake beds, mines. |
Transformation & Interpretation
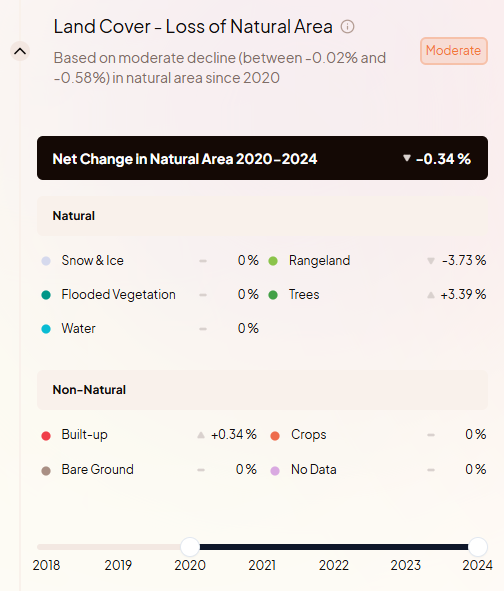
The Land Cover - Loss of Natural Area indicator allows for multiple insights about the state of nature around the assessed site. The primary evaluative indicator consists of an estimate of how much natural land has been lost around an assessed site by analyzing changes in land cover over time. Alongside this quantitative scoring (which is translated into a concern level for the purpose of site prioritization) the indicator allows for visual inspection and understanding of the land cover around a site in a given year.
Loss of Natural Area indicator
Land-use change is the most important driver of man-made nature and biodiversity loss globally. Land-use change generally implies the conversion of land cover from natural land (forests, grass lands, water, etc.) to productive land (agricultural fields and urban areas). The Loss of Natural Area indicator provides an estimate for the extent of land conversion around an assessed site by performing the following analysis:
- Differentiate between natural land covers, namely Trees, Rangeland, Flooded vegetation, Water and Snow/Ice, and non-natural land covers (Built-up areas, Crops and Bare Ground).
- Calculate the share of natural land for the assessed site. If the site analysis is based on a coordinate, a circular area with a 300m radius around the site coordinate is assessed. If the analysis is based on the exact site polygon, the area within the polygon boundaries is considered.
- Calculate the loss in the share of natural land between the most recent year and the year 2020. The year 2020 is used as the reference year based on regulations (EUDR) and guidelines (SBTN) that propose the 31.12.2020 as a temporal reference point, after which no land conversion shall occur.
- The loss in natural area is translated into a concern level, based on how much share of natural area has been lost:

Loss of Natural Area | Concern Level |
|---|---|
No loss of natural area since 2020 | Very Low |
Minor loss of natural area since 2020 (less than 0.016%) | Low |
Moderate loss of natural area since 2020 (between 0.016% and 0.58%) | Moderate |
Strong loss of natural area since 2020 (between 0.58% and 3.73%) | High |
Very strong loss of natural area since 2020 (more than 3.73%) | Very High |
The percentage based thresholds are based on a statistical analysis to determine meaningful benchmarks for the extent of land conversion. Specifically, 10’000 randomly distributed terrestrial areas with a size of 400ha have been sampled and assessed in terms of how much natural area has been lost between the years 2020 and 2023. The thresholds (0.016%, 0.58% and 3.73%) correspond to the 25th, 50th and 75th percentile of all locations that experienced a loss of natural area. This means, 25% of all randomly sampled areas that experienced loss of natural land have lost a share of natural area lower than 0.016%, 50% of these areas have lost a share lower than 0.58% and 75% of all these areas have lost a share lower than 3.73%. In other words, a concern level of Very High implies that the assessed site has lost a higher share of natural areas than 75 out of 100 other sites that lost natural land between 2020 and 2023.
Interactive Land Cover visuals
Aside from the evaluative indicator on Loss of Natural Land, the Land Cover indicator allows for a range of interactions that help better understand the land cover around sites and its evolution over time.
Land Cover Change Over Time: Use the slider to analyze how the share of different land cover classes have changed over time. Selecting the range between 2020 and the most recent year provides the information on the net change in natural area that determines the indicators concern level (see above).
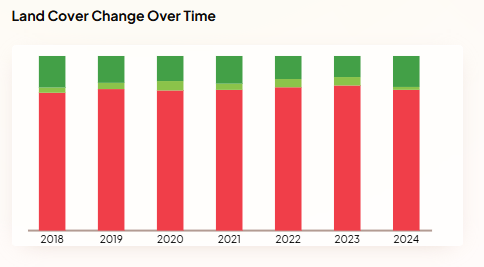
Annual Breakdown: Select “Annual Breakdown” to view the breakdown of land cover classes across different years and see how the respective shares change over time.
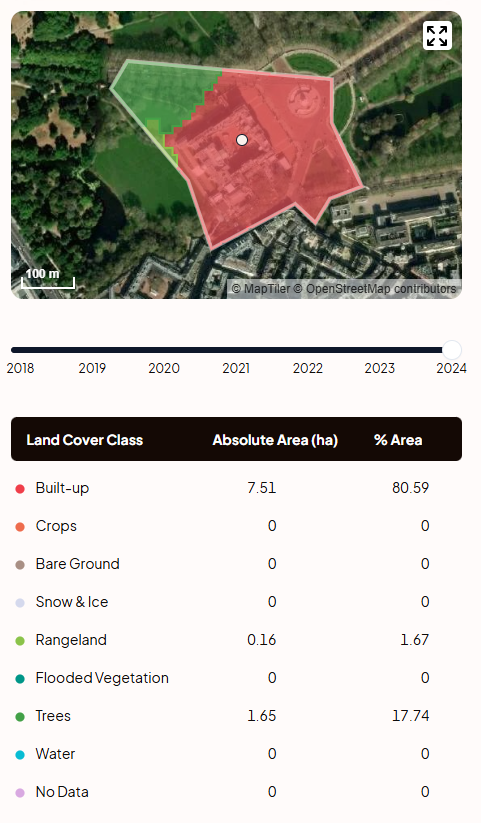
Land Cover Map: View the land cover data set projected on a high resolution satellite image. Toggle between different years to visually inspect changes of land cover over time.
Source
The Sentinel-2 10-Meter Land Use/Land Cover data is provided by ESRI.
Date of publication
2025
Confidence & Accuracy
Medium. The ESRI Land Cover data set is a leading land cover dataset. While the ESRI data set features the highest accuracy out of comparable data products, the global accuracy remains only moderate. With an overall accuracy of 75% the ESRI dataset only accurately predicts the correct land cover 3 out of 4 times. The prediction precision varies across different land cover types. Most precisely predicted are the land covers Water, Trees, Crops and Built-up areas (>80% precision). Considering the datasets’ moderate accuracy, this indicator should be viewed as a first screening for sites with signs of land conversion. Results should be interpreted with caution and are best substantiated through local verification.
Another caveat of the Loss of Natural Area analysis lies in the binary categorization of different land cover classes as natural and non-natural. While the above categorization is likely to be generally adequate, there will be instances where it is incorrect. For instance an area identified as Trees might not actually correspond to a natural forest but really be a non-natural tree plantation (e.g. palm oil). Or Bare ground areas which is categorized as non-natural might correctly identify mines as non-natural, but will also label naturally occurring deserts as non-natural.
Relevance for CSRD
CSRD requires companies to assess site-specific level of land degradation. The Land Cover - Loss of Natural Area indicator specifically is relevant to the following ESRS requirements:
ESRS Article | Disclosure or application requirement |
|---|---|
ESRS E4 DR 16 (b) | The undertaking shall disclose: (…) whether it has identified material negative impacts with regards to land degradation, desertification or soil sealing (…) |
ESRS E4 DR 38 (a) | If the undertaking has concluded that it directly contributes to the impact drivers of land-use change, (…) it shall report relevant metrics. (…) (a) the conversion over time (e.g. 1 or 5 years) of land cover (e.g. deforestation or mining) (…) |
CSRD requires companies to consider and describe the data used in their analysis (ESRS E4 AR 27). For convenience, here a description of for the relevant criteria:
ESRS Article | Disclosure or application requirement |
|---|---|
(a) methodology, | Methodology: The ESRI land Cover data is based on Sentinel 2 satellite imagery to which a trained deep learning model for land classification is applied in order to predict the most likely land cover of a10mx10m area. Reason for selection: The indicator has been selected to assess the level of land conversion around business sites. The conversion of land cover over time is references as a relevant metric under ESRS E4 DR 38 (a). Assumptions: The indicator assumes that land cover types are predicted with sufficient accuracy. Limitations & uncertainties: ESRI land cover data is based on satellite imagery, allowing for global coverage and timely updates. The accuracy of ESRI land cover data remains moderate with a global accuracy rate of 75%. As such the data is suitable for a screening, however is best complemented with local verification. |
(b) scope of metric | The Land Cover - Loss of Natural Area indicator is applied at site level. |
(c) biodiversity component of metric | The Land Cover - Loss of Natural Area is an ecosystem-level nature indicator. It assesses a combination of ecosystem extent and structural element of ecosystem condition. |
(d) covered geographies | The Land Cover - Loss of Natural Area indicator has global coverage. |
(e) integration of ecological thresholds | The Land Cover - Loss of Natural Area indicator relates to the planetary boundaries of land-system change and biosphere integrity. |
(f) frequency of monitoring, baseline condition and period | The land cover data underlying the Land Cover - Loss of Natural Area indicator is updated annually. The year 2020 is used as the temporal baseline against which changes in land cover are compared. |
(g) data type (primary, secondary, modelled, expert judgement | The Land Cover - Loss of Natural Area indicator relies on secondary data, specifically on satellite imagery. |
Relevance for TNFD
The Land Cover - Loss of Natural Area indicator is a suitable indicator to identify areas of rapid decline in ecosystem integrity under the criteria of Ecosystem Integrity within TNFD’s LOCATE step.
Relevance for SBTN
The Land Cover - Loss of Natural Area indicator is a suitable pressure-sensitive State of Nature indicator for the pressures land use change and land use. The indicator is useful to SBTN Step1: Assess and Step 2: Interpret & Prioritize.
| SBTN Data & Tool Criteria | Evaluation | Comment |
|---|---|---|
Relevance | ✅ | Loss of Natural Area is a pressure-sensitive state of nature indicator (land) aligned with SBTN methodology. |
Representative | ✅ | Loss of Natural Area represents a close fit with the SBTN characterization of pressure-sensitive state of nature indicators and is appropriate to be applied under Step1: Assess and Step 2: Interpret & Prioritize. |
Spatial and Temporal Resolution | ✅ | The Loss of Natural Area indicator is provided at the spatial resolution of 10mx10m. The land cover data is available for several years, with the most recent data from 2023. |
Stability and Preservation | ✅ | The land cover data sets underlaying the indicator are likely to be maintained and preserved long-term as they are provided by ESRI and are widely used. |
Accessibility | ✅ | The ESRI land cover data is readily accessible online. |
Interpretability | ✅ | The Loss of Natural Area indicator is sufficiently interpretable and generates an appropriate input for the SBTN methodology. |
Coverage | ✅ | The Loss of Natural Area indicator has global coverage. |
Authoritative and Accurate | ✅ | The ESRI land cover data is widely used in assessments of land conversion and based on a science-based and peer-reviewed methodology. |